USA National Team Analysis

In a previous post, I looked at some data on partnership pairings in T20 cricket.

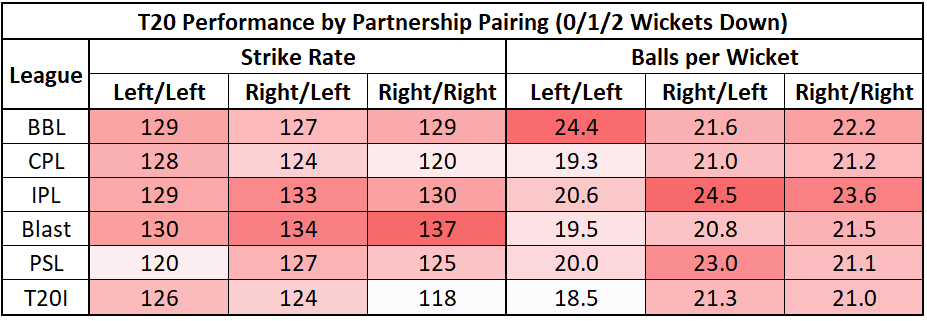
First, I looked at partnership performance by handedness of the pair at the crease-i.e., same-handed vs Right/Left combination. There was some evidence that Right/Left partnerships offered a small benefit compared to same-handed partnerships, but it wasn’t present across all leagues. All in all, it seemed beneficial to go for a Right/Left partnership if the opportunity presented itself, but a team shouldn’t force it.

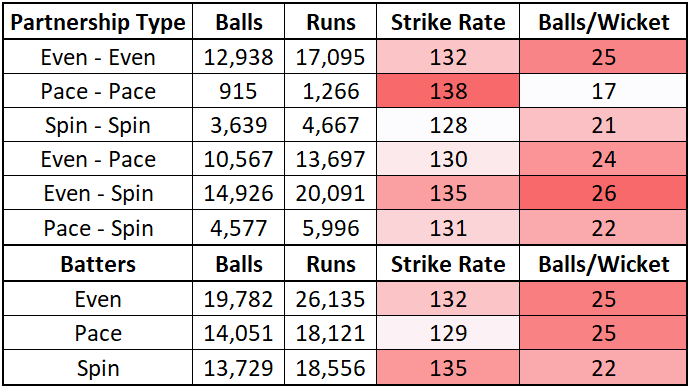
Second, I looked at partnership performance by batting tendency of the partnership-i.e., does pairing a Spin-favoring hitter with a Pace-favoring hitter offer any benefit. Considering many players are what we’d call “Even”-i.e., not favoring one or the other, the conclusion was that Pace/Spin doesn’t offer any specific benefit, but it is wise to avoid Pace/Pace or Spin/Spin partnerships. These simply allow the bowling team to effectively attack batters’ weaknesses (or at least, neutralize their strengths) by bowling-for example-Spin bowlers at batters who prefer Pace.

Next, we’ll look ahead to the US National Team squad for the ICC Men’s T20 World Cup Americas Qualifier.

US National Team Analysis

The United States National Team has not played a T20 since the last Americas Regional qualifier in Bermuda over two years ago. We can still take ball-by-ball data in T20s, but we will also need to look at and heavily weight data from ODI matches to classify national team batters as preferring Pace or preferring Spin. Unfortunately, data from the recently-completed Minor League Cricket season-which involved almost all of these players-does not reliably classify bowlers as pace or spin bowlers, and therefore can’t be used for this analysis.

All of that is to say we’re working with limited and flawed data, but hopefully it’s at least a start and perhaps can spark some more nuanced discussion about selection policy and playing XI selection. This will also be a mostly batting-focused analysis.

USA ODI Batting Tendencies

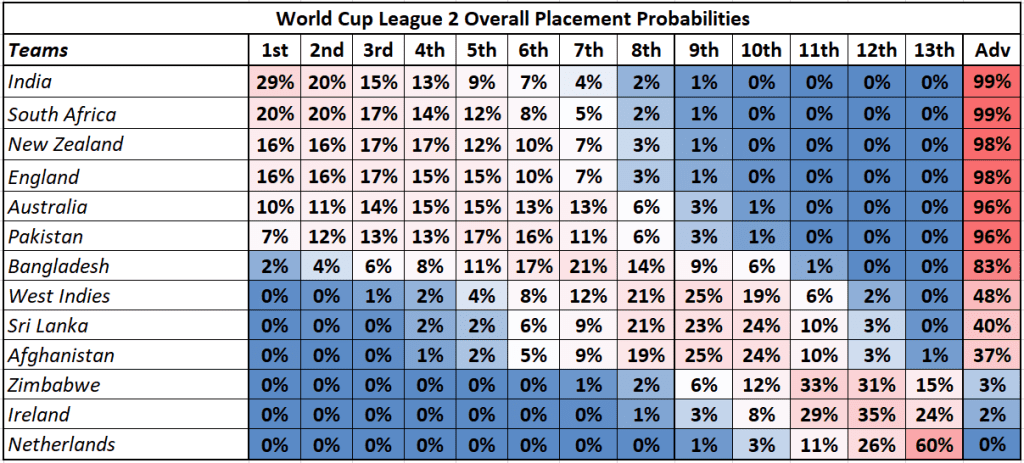
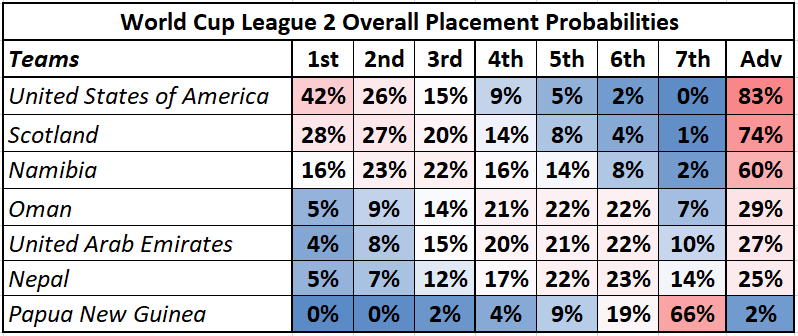
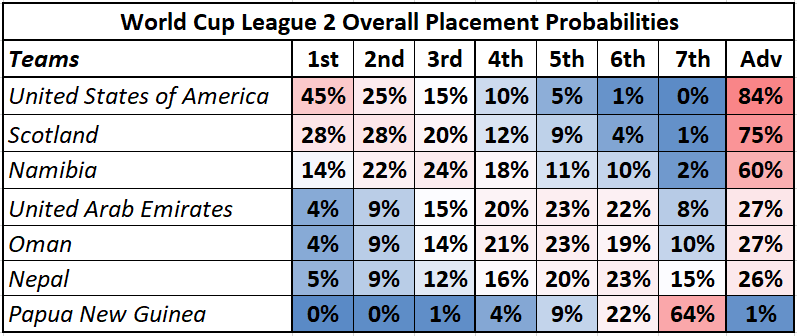
Playing in the Cricket World Cup League 2-including 6 ODIs on a recent tour of Oman-offer quite a bit of data for us to munch on when analyzing batting tendencies in ODIs.

For each of Pace and Spin, we’ll look at a batters’ Strike Rate (SR) and Balls Per Wicket (BPW). In T20 cricket, Strike Rate is king-but in ODIs, wickets are more valuable, so we’ll put a little more weight on Balls Per Wicket here than we will on the T20 side.

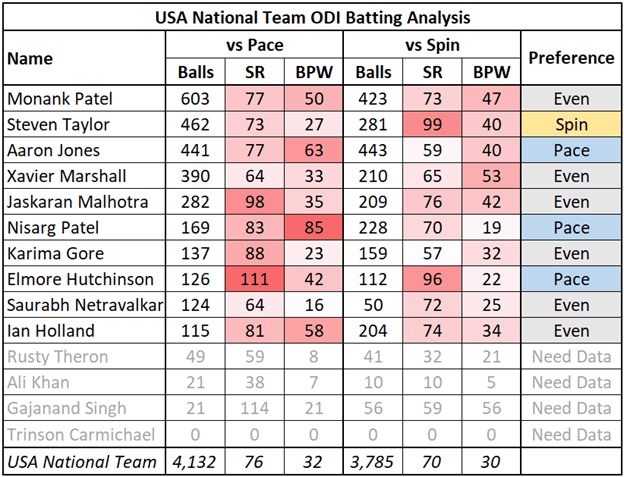
As a team, the USA prefer Pace by a small margin, no surprise, and common especially in Associate cricket. Most players show no obvious preference by the numbers, with reasonably close metrics against both Pace and Spin. Four stand out as having a clear preference: Steven Taylor favoring Spin and Aaron Jones, Nisarg Patel, and Elmore Hutchinson favoring Pace.

The preferences for these players are clear on both a Strike Rate and Balls Per Wicket perspective. Only 2-Taylor and Jones-are specialist batters. Nisarg Patel is not quite an all-rounder but has provided some handy runs down the order, and of course Elmore Hutchinson has had some legendary late knocks (and has a team-leading 9 sixes in League 2 competition!).

Of the remaining key batters, Monank Patel, Xavier Marshall, and Jaskaran Malhotra perform roughly equally against both Pace and Spin, and there’s not enough ODI data to really judge Gajanand Singh yet, though he boasts a strong strike rate against Pace off of 21 balls.

USA T20I Batting Tendencies

Again, the data here is spottier and much older, so we can’t draw strong conclusions from this-but it’s still worth having a look. Strike Rate is more important in T20s and will get more weight when assigning ratings. Where it applies, this data includes performance in (non-MiLC) Domestic T20 leagues-basically for Ali Khan and Gajanand Singh in the CPL and Ian Holland in the Blast.

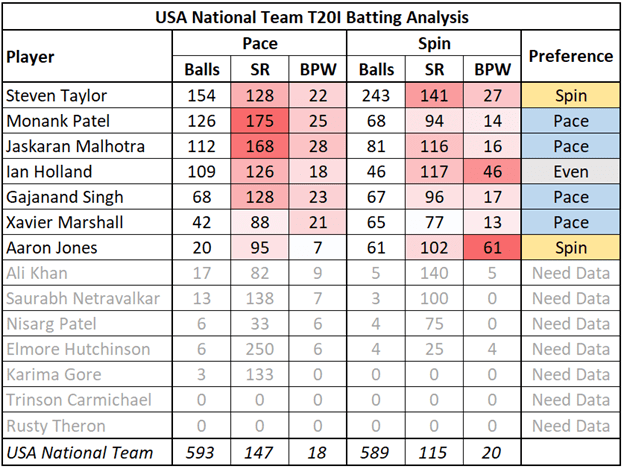
Here, the Pace preference for Team USA is stark-147 strike rate against Pace and just 115 against Spin. Again, most of this data is coming from one tournament in Bermuda, so shouldn’t be taken as gospel. It follows that four players have Pace preferences: Monank Patel and Jaskaran Malhotra are dramatic differences, while Gajanand Singh and Xavier Marshall have slight Pace preferences. As with ODIs, Steven Taylor prefers Spin, and in a limited sample, Aaron Jones prefers spin, having been dismissed just once against it in 61 deliveries.

The only other player with sufficient data to make a judgement is Ian Holland, who has even performance vs Pace and Spin. Basically the whole of the bowling attack haven’t faced enough deliveries to judge.

USA Overall Tendencies

Putting both ODI and T20 data together, we get the table below. Overall Ratings were judgement calls based on the data from both formats.

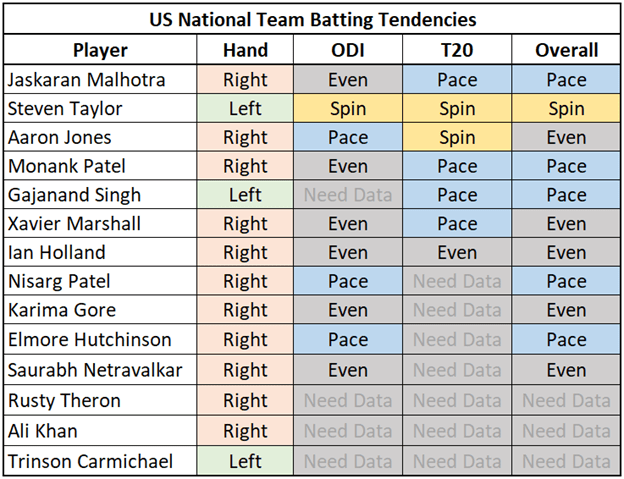
Given the data referenced in the introduction, we can start to think about intriguing partnerships or partnerships to avoid. Here, we’ve also included handedness-the USA is a little weak on left handed batters. Ryan Scott, who starred in MiLC, would be an intriguing addition, but would also replicate Steven Taylor’s opening role.

The partnership that jumps out to me is a potential Steven Taylor/Jaskaran Malhotra opening partnership. Malhotra opened most of the year for the Morrisville Cardinals, and Steven Taylor is a well-established opening batter. This also checks the Right/Left box, and while neither have obvious weakness vs Pace or Spin, Taylor’s preference for Spin and Malhotra’s preference for Pace would make it challenging for the bowling team to pin down any matchups.

On the flip side, there aren’t necessarily obvious partnerships to avoid. Most USA players don’t have clear Pace/Spin preferences. Jaskaran Malhotra and Monank Patel are both right-handed batters who seem to favor Pace in T20s, but their ODI records suggest competency against both Pace and Spin, and they had several fine partnerships in Oman. It would probably be best to not use Gajanand Singh early on with Steven Taylor, as there’s just the two lefties and you don’t want to burn them together.

A Note on the Bowlers

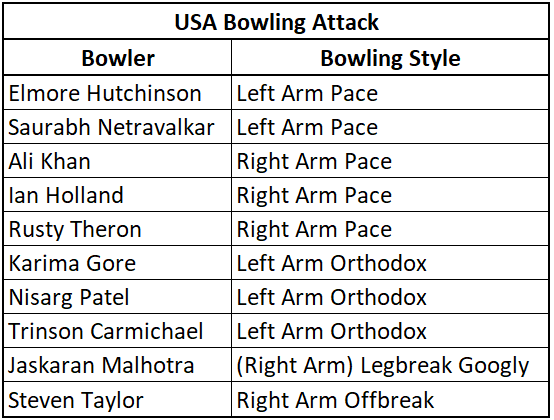
Most of this article focuses on Batting performance, but I’m about to pick XI’s, and you can’t do that without bowlers! Looking at Pace bowlers first, the USA has a varied attack in terms of both handedness and speeds. Saurabh Netravalkar and Ali Khan should be written on the team sheet in pen and offer challenges from both the left and the right.

The USA has an absolute excess of excellent Left Arm Spinners-Karima Gore, Nisarg Patel, and Trinson Carmichael were selected for this tour, but that still leaves great players out like Karthik Gattepalli, Vatsal Vaghela, Sanjay Krishnamurthi, and Nosthush Kenjige. But Right Arm spin remains a weakness for the USA, and it’s vital to have good spin variation in high-level T20 cricket. Part-timers Steven Taylor and Jaskaran Malhotra may be enough to get by in a regional tournament, but a specialist (Ray Ramrattan? Others? Tell me there are others!!) will be needed at the Qualifiers or in a World Cup.

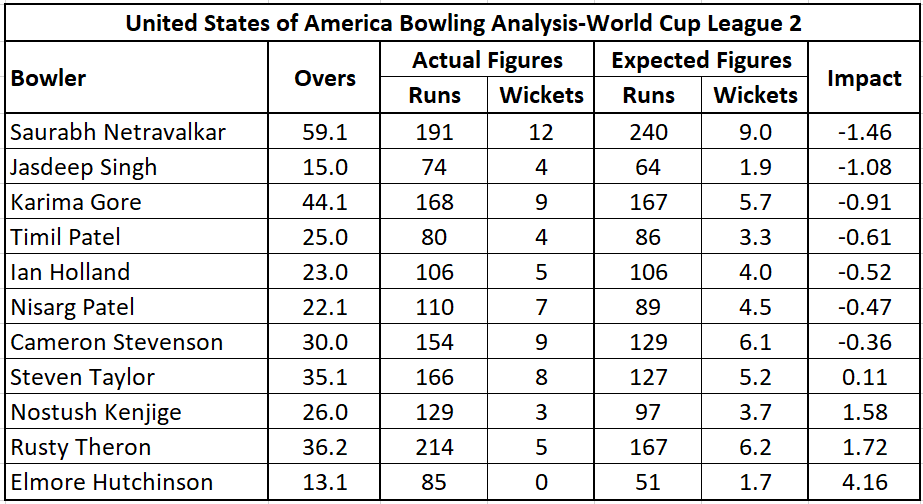
The table below shows the extensive bowling attack for Team USA on this tour.

My Suggested XIs

Finally, we can put all of this together! I’ll present a few XIs, considering player roles, with a few notes on each.

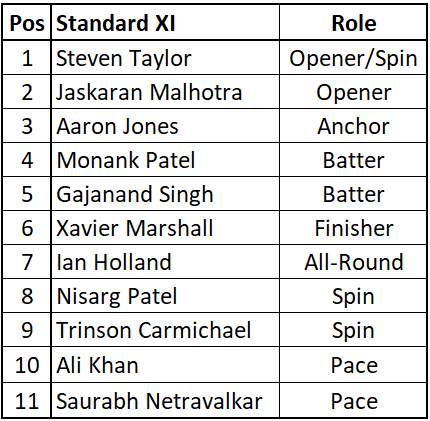
First up, here’s what would be my default XI in Antigua. Start it off with the opening partnership referenced earlier-Steven Taylor and Jaskaran Malhotra.

I’m not a huge fan of the Anchor role, as you basically want everybody to just hit as many boundaries as possible. But losing wickets is more damaging in Associate cricket than at the upper levels-Aaron Jones doesn’t have a great strike rate in either form of cricket but does an above-average job protecting his wicket. He can come in at 3 and keep the ship steady in case of tricky conditions. In the case of a strong opening partnership, Monank can also be brought in at 3 to keep bashing it around.

Gajanand Singh and Xavier Marshall wrap up the specialist batters. I give Xavier the “Finisher” title on the back of his strong 147 strike rate in MiLC. Xavier should get balls at the end instead of Gajanand if it gets to the late overs with just a couple wickets down.

On the bowling side, Ali Khan and Saurabh Netravalkar are must-picks and form the backbone of the bowling attack. With Ian Holland filling an all-round role, that leaves room for two specialist spinners. Based on MiLC and USA form, Karima Gore has to be the odd man out, with Nisarg Patel and (debutant) Trinson Carmichael finishing out the XI.

In addition to Karima Gore, this also leaves out Elmore Hutchinson and Rusty Theron. Elmore can provide some explosive batting, but his bowling has been weak in MiLC and USA action. Rusty Theron did have an excellent MiLC season, and I wouldn’t protest his inclusion at the expense of either spinner or even perhaps Ian Holland.

In total, this uses all 6 specialist batters plus Ian Holland-I would have liked to see an extra bat brought along on the tour (As a 15th man, or at the expense of one of Gore/Elmore) to provide more flexibility. The USA has a tendency to use a billion bowlers (OK, but literally 8-9 per match) in ODI cricket, but that’s really not necessary or at all optimal in T20s.

Next, we’ll look at XIs for Pace or Spin friendly conditions:

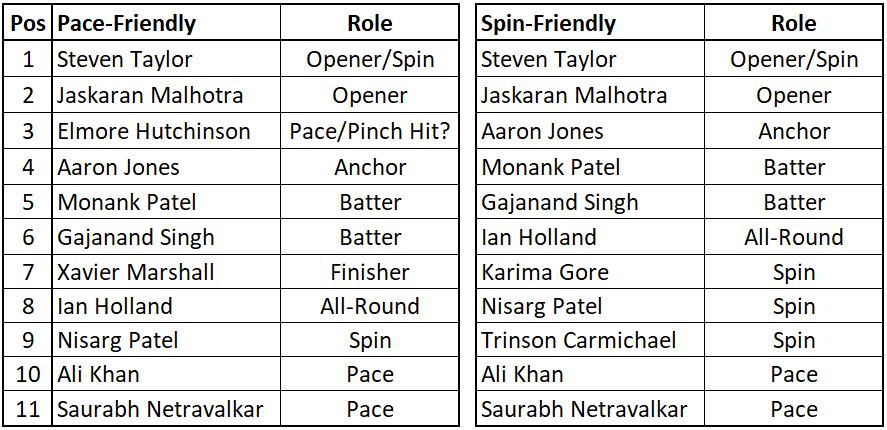
First up, the Pace-friendly conditions XI. I got a little creative here. I know I just talked down Elmore’s bowling a little bit, but he’s on the tour-might as well have fun with him. Elmore has provided incredible value with the bat late in ODIs, and in the recent Nation’s Capital T20 tournament, scored 89 runs at an outstanding 212 strike rate (best in the tournament for players with at least 50 runs!!). If conditions are pace-friendly, his bowling can be passable, and I would love to see him come in early to knock it around if the USA can play the match-ups right (i.e., bat him against pace). The remainder of the lineup is more or less the same-Elmore’s inclusion comes at the expense of Trinson Carmichael-Nisarg/Steven Taylor/Jaskaran Malhotra can handle all of the spin if conditions favor pace. An alternative and more traditional XI would simply use Rusty instead of Elmore (but not as a pinch hitter!).

Second, the Spin-friendly XI. There’s room for all three specialist spinners in the lineup. Even here Ali Khan and Saurabh Netravalkar are still must-plays, so that means we need to lose a batter-not a huge deal as Karima Gore can provide some runs, albeit moreso against Pace. In limited data, Xavier Marshall has extremely weak figures against Spin in T20s, so he’s the odd man out. I also thought about tossing Gajanand Singh, but that would leave Steven Taylor as the only left-handed bat in the lineup.

Conclusions

Hopefully this was an interesting look at Team USA ahead of the Regional Qualifiers in the Americas! I’m certainly not the most knowledgeable USA Cricket Fan or cricket analyst in general, so bug me on Twitter if you think I’ve gotten any of this horribly wrong. Would love for this to spark some discussion around the USA National Team.

T20 Partnership Analysis

Introduction

In this post, I will do some light analysis on partnership pairings in T20 cricket. We’ll look at whether or not it’s beneficial to pair left-and right-handed batters together, as well as whether or not it’s beneficial to pair pace-favoring batters with spin-favoring batters. This is not meant to be a thorough or comprehensive analysis-simply a look at some high-level data to see if there are any obvious conclusions to be drawn.

Partnership Pairs by Batter Handedness

First, we’ll look at partnership pairings by batter handedness. The theory here is having a right/left partnership at the crease is more challenging for the bowling team. Fairly simple logic-with a partnership split by handedness, the fielding team has to change fields more often and bowlers are forced to change their lines more often. Additionally, the batting team may be able to better avoid handedness-based weaknesses by strategically rotating the strike.

We’ll look at performance by partnership pairing across T20Is and major domestic leagues. We’ll only look at the first three partnerships of each match (i.e., when the batting team is down 0/1/2 wickets), as this guarantees we’re looking at top-level batters, and this is when the batting team has the most control over which partnerships are at the crease.

Here is a table showing Strike Rate and Balls per Wicket for each league and partnership pairing:

Some of this analysis is influenced by differences between Left- and Right-handed batters in certain leagues. In particular, Right-handed batters perform much weaker in the CPL and in T20Is.

Otherwise, there’s a bit of a mixed bag of results across the board. In the IPL and PSL-arguably the two biggest and most advanced (analytically speaking) leagues in the world, it does appear that Right/Left partnerships have slightly stronger strike rates and last longer than same-handed partnerships. But other leagues don’t obviously show this pattern-the BBL seems to show that Right/Left partnerships are marginally weaker.

Conclusion: All in all, there is some evidence that Right/Left partnerships perform slightly better than same-handedness partnerships, particularly in the IPL and PSL. But this doesn’t seem to extend to all leagues, and the benefits remain relatively minor. If it doesn’t involve putting a weaker batter at the crease, it seems beneficial to opt for a mixed-handedness partnership when the batting team can do so.

Partnership Pairs by Pace/Spin Preference

The other consideration when determining strong partnerships is whether the batters favor pace, favor spin, or are equally adept at both. Here, a “split partnership” (i.e., a batter strong against spin paired with a batter strong against pace) would allow the batting team to rotate the strike to avoid weakness and exploit matchups against the bowlers. A partnership between two pace-hitters or two spin-hitters could make it easy for the bowling team to exploit batting weaknesses (i.e., putting a spin bowler in against two batters that love pace).

In this analysis, we’ll again focus on the first three partnerships of the match, and look at data from only the IPL-spin conditions vary across the world and isolating a single league will be the cleanest analysis. In general, strike rates against Pace are stronger than strike rates against Spin. So a “Pace Hitter” is defined as a batter who has a strike rate against Pace that is +13% or more better than their strike rate against Spin. A “Spin Hitter” is a batter who simply has a higher strike rate against Spin than against Pace. The remaining hitters are classed as being “Even”, with no strong preference for Pace or Spin.

Here is a table showing Strike Rates and Balls/Wicket by partnership type:

The results are mixed. It’s certainly not clear that a Pace-Spin partnership is obviously better than the alternatives. There is some evidence that Pace-Pace (loses wickets often) and Spin-Spin (low strike rate and loses wickets often) partnerships are weak and easily exploited by the bowling team.

Conclusion: All in all, it seems best to avoid partnerships that pair two players that specialize in hitting pace or spin. This makes it too easy for the bowling team to counter with a bowler that can exploit their weakness or at least neutralize a strength.

Conclusions

In summary, there may be some evidence that Right/Left partnerships perform better than same-handed partnerships. There is less evidence that pairing Pace-favoring batters and Spin-favoring batters yields stronger performance, but it is at least apparent that you don’t want to pair batters together that both favor Pace or both favor Spin.

In general, given the relatively weak advantages at play within this analysis, it’s perhaps more important to consider other factors when constructing a game plan-players’ preferred role within the batting order, speed running between the wickets, and the experience of two players batting together.

New Limited Overs Cricket Models

The extended cricket hiatus brought on by the devastating COVID-19 pandemic brought my Cricket Simulations to a grinding halt, but freed up plenty of time to re-think and re-evaluate my current cricket modeling methods.

Coming from a statistical background, it is tempting to create models that simulate events at the lowest possible granularity-in cricket, this means a ball-by-ball simulation. So that’s what I set out to do over a year ago when I started up my cricket modeling and simulation adventure. While I succeeded in a very literal sense at being able to simulate a cricket match ball-by-ball, over time I’ve come to be frustrated by the usability and-at times-accuracy of my existing model. This article will explore what was wrong with the old model, and what is right with the new model.

What was wrong with the old model?

Well, quite a bit, as it turns out. First, we’ll go over a recap of how the old model was created. I did not attempt to model individual players, logic being that quality of international teams does not change at a rapid pace over time, and modelling individual players would require somehow figuring out future lineups.

For each team, I would split the batting lineup into four groups: Top Order, Upper Order, Lower Order, and the Tail; bowlers were split into two groups: Opening Bowlers and all Other Bowlers. For each of these groups within a team, I would model the speed at which they make or give up runs, and the rate at which they gave up or took wickets.

I would then calculate average expected runs and average probability of a wicket for each match situation, accounting for the over of the match and how many wickets have already fallen. These averages could be applied to the team-level coefficients referenced above to calculate expected runs and probability of a wicket for each ball in a simulation.

When I simulated a match, I wouldn’t actually attempt to simulate a “chase” for the second innings-I would just simulate each innings as if its the first innings, and then whoever ended up with more runs was the winner.

So with some detail on what the old model was like, let’s go through the flaws point by point-some of these driven by a lack of understanding of the game cricket (I have, after all, never so much as seen the game played in person) and some of these are just math issues:

“Opening Bowlers” and “Other Bowlers”??: What in the blazes was I thinking here eh? Basically I said “the first two bowlers that appear are your opening bowlers, and everybody else is the same”. When simulating, I’d have the opening bowlers take the first and last parts of the innings, with the other bowlers in the middle. This was a feeble attempt to mimic “batting order” for bowlers. What would have been better in retrospect would have been to just model Powerplay, Middle-Overs, and Death bowlers all separately. I’m not sure this significantly impacted model accuracy, but it does seem like a super questionable decision in retrospect.

Unstable Model Results: Often times I’d update the model, run some simulations, and then be left scratching my head at why I’m getting dramatically different results with just a couple new matches. With all the moving parts, I’d have to check my baseline run and wicket expectancy values as well as new batting or bowling performances. Maybe some dude in Canada’s upper order went 85* (50) and totally threw off their coefficients because it’s only their 10th match in my database. Or maybe whoever played the USA had a first change bowler take 5 wickets for 10 runs, and my model still thinks the USA is good for some reason so now those bowlers look amazing. With so many moving parts, it was difficult to stay on top of the model and keep it stable and reliable.

Modeling and Simulation Run-Times: The complexity of the model needing to ingest ball-by-ball data and then simulate future/hypothetical matches ball-by-ball doesn’t necessarily require significant computing power, but does eat up quite a bit of time. This was especially painful when I wanted to simulate (1,000-2,000 times) long-term tournaments like the 2023 World Cup Qualification cycle.

Cricket is a Complex Sport to Model: Turns out, cricket is complicated! I’m relatively new to the sport-I’m used to baseball, where performance throughout a game is relatively stable regardless of game situation. There’s no playing passively or aggressively as you might have in certain situations in cricket. There are also changes in pitch conditions or weather that can have dramatic impacts on play, even between matches at the same ground. Attempting to properly model the cadence of a run chase or the nuances of bowler selection or the impact of overcast conditions is extremely difficult. I didn’t attempt to, as doing it poorly would just make the model worse, but then you’re leaving information and data on the table, and the exercise of doing a ball-by-ball model is a bit more pointless.

So with all that said and known, I wanted to set out to create a new model that was simpler, more streamlined, and would lead to less overhead and headaches on my part.

What is right with the new model?

The new model is significantly simpler than the old model. No longer do we care about the rate of wickets taken in the 16th over when a team is 4 wickets down. No longer do we care about the speed at which Oman’s Lower Order score runs. The new model simply reduces a team’s quality down to one single number based on historical match outcomes.

How does this model determine match probabilities?

Let’s take a look at the math. First, we’ll skip to the end-let’s look at an example of how the ratings are used to generate a prediction. Say Team A is playing Team B. The formula used to determine Team A’s probability of winning is:

1/(1+EXP(Team B Rating – Team A Rating))

To get some real numbers, let’s take matches coming this weekend (as I write this on 9/3/20): a T20 series featuring Australia in England.

Australia carries a T20 rating of 1.630, and England carries a T20 rating of 1.498. Home field counts for something, boosting England’s rating up to 1.580. So we can calculate…

Prob(England Win) = 1/(1+EXP(1.580 – 1.630)) = 0.488 = 48.8%

Fun stuff! Super simple math, easy to write code to simulate future matches and tournaments in nothing more than a jiffy. But how did we get those ratings?

How does this model generate team ratings?

There are several steps to generating those final ratings-we’ll stick with Australia and walk through the math of how we got to that rating of 1.630.

First, we have a database of historical results-For each match we have the teams involved, the winner, the country the match was played in, and the margin of victory-either the number of runs or the number of wickets, along with the overs remaining if a team won in a chase. Many models would simply record the winner or loser, but we should account for margin of victory: Necessary for models like this, where many teams at the lower levels have infrequent matches. A simple win/loss model does not give us enough information to generate a reliable rating system.

This part is kind of interesting-I used my old ball-by-ball simulations (hey, still useful!) to gauge the median winning margin for a team that has a certain percentage chance of winning. For example: In T20, a team with a 77% chance of winning has a median win margin of 34 runs when batting first. When batting second, this is a median win margin of approximately 7 wickets with 3 overs left. So if a team wins by 34 runs in a T20, I’m awarding them 0.77 wins, and their opponents 0.23 wins, rather than 1 and 0. This goes a really long way to allowing the model to more accurately gauge relative strength of teams, particularly those who do not play a significant amount of matches.

Along with the information above, we’re also incorporating a home field advantage variable and giving more weight to recent matches (overall, we’re using matches since 2015). To aid in generating more accurate ratings (better connectivity) for teams lower in the rankings, we’ll give 25% weight to 50-Over matches in our T20 model, and 25% weight to T20 matches in our 50-Over model. This doesn’t make a big difference for teams near the top, but helps for a team like say, Papua New Guinea, who has been a top Associate in T20 cricket while going winless in the CWC League 2. The need for this connectivity can be seen in the graphs below:

While connectivity is still not perfect, it is vastly improved in the final Limited Overs chart that accounts for both T20 and 50 Over match-ups instead of treating T20 and 50-Overs as completely distinct.

Once we have all this, we can generate ratings for each team using the simple Excel Solver add-in. This generates a first pass at ratings. But to be a more effective predictive model, I like to do some regression to the mean. This is not perfect and is a little bit arbitrary, but I really think it improves model performance-a team who has performed extremely well in the past is more likely to fall back to earth a bit, and vice versa for a team who has really struggled.

I regress to both the level of a team’s opponents and to an overall mean. So let’s walk through the math for Australia (as context, I hold Ireland at a rating of 0 pre-regression, so teams better than Ireland are positive and teams worse than Ireland are negative):

  1. Original rating of 1.92, based on match weights summing to 33.8 (equivalent to them playing 33.8 matches today, though it represents 150 matches total).
  2. Weighted average opponent quality for Australia is 1.45.
  3. Weighted average overall rating across all teams in the model is -1.349.
  4. We add 5 matches of average opponent quality and 3 matches of overall average team quality to their original rating.
  5. (1.92*33.8 + 1.45*5 – 1.349*3)/(33.8 + 5 + 3) = 1.630.

In addition to providing slightly better predictive quality, this also helps to gauge performance of teams with few matches. By weighting by opponent quality, we get a general idea of where that team “belongs” (unfortunately for the long-term health of the sport, good teams don’t play bad teams). For teams with extremely low numbers of matches played, I only regress 1 match to the mean of their opponents-I do not want to hand out 3 matches of average quality to teams that have only played 5-6 matches overall, as that would dramatically inflate their rating in most cases.

All that said, we can look at actual rankings!

Let’s look at actual rankings!

First up, my personal favorite format: 50-Overs/ODIs! Here are the rankings for the 32 teams involved in the CWC Super League, CWC League 2, or the CWC Challenge Leagues. To provide some context around the ratings themselves, I’ve also provided the probability that a team would beat the team below them in the rankings at a neutral site. For example, India has a 51% chance of beating Australia, etc.

Not much analysis needed-we’ve got a strong Top 6, then a drop-off to spots 7-10, and another drop-off to the low Full Members/high Associates. The model doesn’t think much of the Netherlands’ chances in the Super League, but does really love Canada.

And here we have a Top 25 for T20 rankings. Similar story here, down to the gaps between 1-6/7-10/The Rest:

Conclusions

Congratulations if you’ve made it this far! All in all, I think the new model is a great improvement. It streamlines the math, makes it much easier to maintain, is more reliable, and frankly gives similar results as the old model anyways. Hope you enjoy, and I look forward to using this to simulate an unnecessary amount of cricket in the future.

2023 World Cup Qualification Simulations-January 2020

Months after the thrilling finale of the 2019 ODI World Cup, qualification for the next edition in 2023 is already underway. The road to the World Cup involves 32 teams across 4 competitions that will stretch multiple years ahead of final qualifiers and the 10-team (still far too small!) World Cup. The 4 competitions (3 levels) are:

  • World Cup Super League: This league contains the top 13 teams in world cricket-the 12 full ICC members in addition to the Netherlands, who qualified as a result of winning the 2015-17 ICC World Cricket League Championship. The top 7 teams plus India will advance to the 2023 World Cup, while the bottom 5 teams excluding India will advance to the World Cup Qualifier.
  • World Cup League 2: The next level down includes 7 teams-Nepal, Scotland, and the United Arab Emirates (by virtue of previous ODI status), in addition to Namibia, Oman, Papua New Guinea, and the United States of America (from the final World Cricket League 2 in April 2019). The top 3 teams in this competition will advance to the World Cup Qualifier, with the bottom 4 dropping to the World Cup Play-Off.
  • World Cup Challenge Leagues A/B: At this level, there are 2 leagues of 6 teams each from various levels of the old World Cricket Leagues. The top finisher from each group will advance to the World Cup Play-Off.

This tweet from Bertus de Jong gives a good visual of the complete process, which provides a more stable cricket schedule for many associate sides over the next few years:

Next we’ll look at the current state of each of the four leagues, as well as placement probabilities for each. Probabilities are based on 2,000 simulations.

World Cup Super League

The World Cup Super League will see each of the 13 teams play 24 matches in the form of 8 3-match ODI series-4 at home, 4 on the road. This means each team will not play 4 other sides in the competition, which obviously leads to significant schedule imbalance. The full schedule can be found here.

The competition will get underway in May 2020 when Bangladesh travels to Ireland. Here is the current state of simulations for the competition (Note: India automatically advances to the World Cup Qualifier-this is not reflected in the table below, but is reflected in the rest of the simulations):

The top 5 teams after India in World Cricket are near-locks to make it straight to the World Cup: South Africa, New Zealand, England, Australia, and Pakistan. Bangladesh-by virtue of not playing India, Australia, and South Africa-are also in good position to advance. After that, West Indies, Sri Lanka, and Afghanistan are fighting for the last direct qualification spot or a chance to unseat one of the top 7. Zimbabwe, Ireland, and the Netherlands are all a step behind and long-shots to qualify directly to the World Cup after all missing out on the 2019 edition.

World Cup League 2

The schedule for the World Cup League 2 is much more equitable than the Super League. Each of the 7 teams plays every team 6 times-twice at home, twice away, and twice at neutral sites. Each team will be a part of 9 tri-series over 3+ years, meaning a solid total of 36 guaranteed matches per team, 12 more than the Super League.

As of this writing, 4 of the 21 planned tri-series have been played-the United States have gotten off to an early lead with 6 wins from their first 8 matches. At the other end of the table, Papua New Guinea are 0-8, while Nepal has yet to play a match.

Standings and Simulations:

World Cup League 2 Standings

The fast start and resulting strong ratings give the USA a solid chance of making it straight to the World Cup Qualifier. Scotland were strong favorites coming into the competition, but a mediocre start has left them some work to do going forward. Namibia rounds out the expected Top 3, with Oman, United Arab Emirates, and Nepal also expected to be in the mix. Papua New Guinea would need a dramatic reversal of fortune to get straight to the World Cup Qualifier.

World Cup Challenge Leagues

Each Challenge League will be played as 3 single round robin tournaments, with each team getting a total of 15 matches. There is some schedule unbalance here as only a few teams will get the advantage of home field. The teams are split as follows:

A: Canada, Denmark, Malaysia, Qatar, Singapore, Vanuatu

B: Bermuda, Hong Kong, Italy, Jersey, Kenya, Uganda

World Cup Challenge League A

The first series in League A took place in Malaysia in September, with the next coming up in mid-March, again in Malaysia. Standings and Simulations:

Despite being tied on points with Singapore, Canada is well ahead on run-rate, after posting two scores over 375 in the first round in Malaysia. Canada’s only loss came by just 4 runs against Singapore in a rain-affected match on the final day. The model accounts for margin of victory and accounts for NRR in the simulations, which means it loves Canada, giving them an 85% chance of winning the league even after just one round. Malaysia is hosting at least two-thirds of the league but won’t threaten Canada’s position.

World Cup Challenge League B

The first round of Challenge League B took place in Oman last December, after civil unrest forced it out of Hong Kong. The next stage is scheduled for Uganda in July. Standings and Simulations:

Uganda benefits from a perfect start and hosting duties to sit as a solid 68% favorite to take the league. The model rates Jersey and Hong Kong not too far behind Uganda, but under-performance from Jersey and an unfortunate washout for Hong Kong against Italy set them back in what’s ultimately not a super-long competition.

With all of this information, we can move on to simulating the World Cup Play-Off and World Cup Qualifier to see each team’s probability of advancing to the 2023 Cricket World Cup.

World Cup Play-Off

The World Cup Play-Off will consist of 6 teams, and while the format has not been announced, it can be assumed that it will be a single round-robin, with the top 2 teams advancing to the World Cup Qualifier. The 6 teams will consist of the bottom 4 from World Cup League 2, and then the winners of each of the two Challenge Leagues.

The somewhat messy table below shows-by Level-the probability of each team finishing in a given position in the World Cup Play-Off, as well as the probability of each team actually participating in the Play-Off, the probability of each team advancing to the World Cup Qualifier from the Play-Off, and finally the probability of a team advancing to the World Cup Qualifier if they make the Play-Off.

A look at the bottom 4 sides from World Cup League 2 shows that this is likely to be a wide open and competitive series no matter who takes part. Oman, the UAE, and Nepal are all just about equally likely to finish at the top or the bottom of the table.

As we saw earlier, Canada is very likely to feature in this leg of qualification, and if they make it here, the model gives them nearly a 50% chance of finishing in the top 2. This is perhaps not surprising, as Canada missed out on being in League 2 by the slimmest of margins on NRR in the final World Cricket League Division 2 in April 2019.

The story is not so optimistic for the winner of Challenge League B-likely Uganda at this point, who would have just a 16% chance of advancing to the World Cup Qualifier if they are able to win their league.

World Cup Qualifier

Group Stage

Ten teams will take part in the World Cup Qualifier: The bottom 5 teams from the Super League, the top 3 teams from League 2, and the 2 top teams from the Play-Off. It can be assumed that this tournament will have the same format as the previous 10-team World Cup Qualifier in 2018, which saw the West Indies and Afghanistan advance to the 2019 World Cup.

The first stage would consist of two groups of 5 running a single round robin each, with the top 3 teams advancing to the Super Sixes stage. This table below gets even more complicated, as every team (except India) can theoretically make this stage of the competition. Extra columns are the same idea as before.

Outside of India, there are a few other teams that did not make this stage of the competition over 2,000 simulations-Malaysia, Qatar, Vanuatu, Bermuda, and Kenya. Jersey featured 9 times (advancing three times) and Denmark and Italy each got in once, finishing last. None of this was enough to round up to 1% from 0%.

Otherwise, this is basically the usual suspects of who you would expect to be in a World Cup Qualifier-many of the same teams as the last edition. Important to note that one team would likely be the host and get some boost from home field advantage that’s not accounted for here.

A couple interesting nuggets-it’s not likely that any “Top 6” team ends up here, but over 2,000 simulations, Australia and New Zealand were eliminated from World Cup contention at this stage twice and Pakistan three times.

Super Six Stage

The top 3 teams from each group will advance to the Super Sixes. Results from the Group Stage will carry over, though I have not yet coded that into the simulations. Each team plays the three teams from the other group to complete a single round robin, with the top 2 advancing to the 2023 Cricket World Cup.

The three teams most likely to advance to the World Cup via the Qualifier are West Indies, Sri Lanka, and Afghanistan-two of whom (WI and AFG) did so in 2018. Fellow Super Leaguers Zimbabwe and Ireland are a tier down around 15%, with Scotland, Netherlands, and USA hovering around 10%. Outsiders Uganda and Hong Kong did make it to the World Cup 3 and 1 times, respectively, out of the 2,000 simulations.

Final World Cup Qualification Probabilities

With all of this, we can now calculate the probability of each team making the 2023 World Cup!

At this stage, the top 10 here are the exact 10 teams that made the 2019 World Cup. That’s an unfortunate outlook for those excited for some new faces, but from a purely mathematical standpoint, makes sense given that these 10 teams performed the best in order to qualify last time around. Hopefully we see some movement in the next few months as the Super League gets under way.

Bowling Analysis-World Cup League 2

Introduction

My previous blog post outlined methodology for estimating Bowler Impact-in other words, the number of runs per over above or below average a bowler adds to the opposition’s total. This analysis accounts for the match states in which a bowler appears-overs and wickets left-as well as the estimated run value of a wicket.

In T20 cricket, that value was -4 runs per wicket. Replicating that analysis for ODIs (or 50-over cricket in general), we find a value of approximately -12.5 runs per wicket. For a longer format, it’s obviously reasonable for a wicket to be worth more runs, as batsmen tend to last longer and it’s more likely for a team to be bowled out. Otherwise, everything else about the analysis is the same. Let’s apply it to the ongoing Cricket World Cup League 2!

Top Ten Bowlers

Here are the top ten bowlers for the competition to date (minimum 20 overs):

The top bowler in the competition so far is Zhivago Groenewald of Namibia, who only featured in the United States Tri-Series before not seeing any action in Oman due to a knee injury. Groenewald led Namibia to a big win against the United States in Florida with a 5/20 performance, in addition to two other 3-wicket hauls in the tri-series. The United States has three of the top ten, anchored by captain Saurabh Netravalkar and the off-spinner Karima Gore. Overall, the top ten sees representation from every team that’s played so far.

Team-by-Team Bowling Analysis

Next up, we’ll take a team-by-team look at bowling performance for the competition. Teams will be ordered from best to worst by Bowling Impact.

United Arab Emirates: -0.26

Despite not having any top nine bowlers and just a 3-3 record in the tournament so far, the UAE still sport the strongest bowling attack of the competition. The UAE boast 5 regular bowlers at about a quarter of a run below average per over or better, and no weak links in their usual bowling attack. Captain Ahmed Raza leads the way, forming a restrictive partnership with fellow spinner Rohan Mustafa throughout the middle overs, together allowing about -18% runs fewer than expected between overs 11 and 40.

Death bowling has been something of a strong suit for the UAE, spearheading two of their three wins against Scotland (185/4 to 220 all out in the last 12 overs) and Namibia (defending 67 runs in the last 10 overs). In total, the UAE has taken 35% more wickets and allowed -20% fewer runs than expected in the final 20 overs.

United States of America: -0.09

Even after losing the services of arguably their best bowlers in Ali Khan and Hayden Walsh Jr., the United States has still put together an elite bowling attack. Much of this strength comes from their captain Saurabh Netravalkar, whose precise bowling in the opening overs has led the USA to their 6-2 start in the competition.

In the first 10 overs, Netravalkar has taken 8 wickets for 89 runs at an average of 11.1-this is an incredible -33% fewer runs than expected and almost twice as many wickets as expected in this time period. His death bowling has been equally outstanding, including single-handedly bowling out the UAE for 202 from 190/6 on their home turf.

Karima Gore was a revelation for the USA in their home tri-series, taking figures of 3/25, 2/15, and 4/20 in successive victories to start their World Cup League 2 campaign. Unfortunately he went down with an injury partway through the next set of matches in the UAE. If he’s not back for the Nepal series, the USA will rely on their spin depth of Timil and Nisarg Patel, as well as Steven Taylor.

Namibia: +0.07

The tournament’s top bowler, Zhivago Groenewald, leads the Namibian bowling lineup. Groenewald restricts opponents’ totals by an impressive -2.08 runs per over, but has been sidelined by a knee injury since the tri-series in the United States.

The opening bowling partnership of Jan Frylinck and JJ Smit has been solid, if unspectacular, combining for an impact of -0.32 runs per over in the first 10 overs. Bernard Scholtz has been reliable in the middle overs for Namibia, including figures of 4/27 in a defense of 260 against Papua New Guinea in the USA.

There’s not much to look at in the rest of Namibia’s bowlers-Craig Williams has been expensive and relegated to the middle overs after a couple unsuccessful stints opening the bowling.

Scotland: +0.13

Scotland would always have hoped to bat their way into the World Cup Qualifier, but the bowling has really struggled. Their top 3 and only above average performers are spinners. This spin trio has been consistently solid in the middle overs, both restricting runs and taking regular wickets-combined, they restrict opponents’ totals by -1.34 runs per over between overs 11 and 40.

Outside of this limited success though, it’s been bleak. Scotland allow more runs than average in the first ten overs (+0.45 per over) and the last ten overs (+1.23 per over). This proved fatal in a 35-run loss to the United States, who piled on 77 runs in the final 10 overs, and again against the UAE, who chased down 220 with relative ease after a start of 62/0 in the powerplay.

Papua New Guinea: +0.18

The bowling attack that led Papua New Guinea to the T20 World Cup has been largely ineffective in the 50-over format as they’ve sunk to a potentially insurmountable 0-8 start in the competition. Much of this is down to Norman Vanua and Charles Amini, who are increasing their opponents’ totals by a combined 1.5 runs per over and together account for 31% of PNG’s overs bowled.

One bright spot has been fast bowler Nosaina Pokana, one of the tournament’s top bowlers to date. He’s taken a tournament-leading 17 wickets (including 6 multi-wicket outings) while restricting opponents to -17.7% runs fewer than expected. He’s done most of his damage in the opening and death overs, supported by some reasonable middle-order stability from Assad Vala. Ultimately, Papua New Guinea will need improved bowling depth to compete.

Oman: +0.21

Oman is last on this list largely due to bleeding a tournament-high 324 runs against Namibia last week. They’ve had some solid performances otherwise, bowling Scotland out for 168 in their second match and bowling UAE out for 170.

Zeeshan Maqsood, along with UAE’s Ahmed Raza and USA’s Saurabh Netravalkar, is the third captain to lead his team in bowling performance. In the first match of the UAE tri-series, he bowled out UAE for 170 from 146/6 in the last 12 overs, in addition to a 2/32 performance against the hosts in Scotland to secure a huge road win.

Conclusion

All in all, the Cricket World Cup League 2 has been a competitive and exciting tournament to date. Here is the current state of the competition, per my ratings and simulation models:

Papua New Guinea has taken themselves out a bit after their winless start, but the rest of the table is more or less up for grabs. USA has had the strongest start at 6-2, and Scotland were pre-tournament favorites. Namibia was in great shape before losing a couple in Oman, and that’s opened up the race for the third spot in the World Cup Qualifier, though even the USA and Scotland shouldn’t feel safe quite yet.

Hopefully this bowling analysis has given a useful team-by-team view of the state of the competition from a bowling perspective. I hope to publish a similar analysis for batting over the next few days.

Run Value of a Wicket, and Bowling Analysis of the T20 World Cup Qualifier

Introduction

As an American, I cut my sports analytics teeth in the world of baseball’s sabermetrics. A central tenet of baseball analytics is determining the average run value of each potential plate outcome. We can then determine the value added by a player in all their plate appearances and see how many runs above average they are worth over the course of a season. Baseball even goes a step further and accounts for fielding and base-running abilities to determine a player’s Wins Above Replacement.

In cricket, this type of exercise seems easier in theory-a run is a run, although we want to account for the match state (overs and wickets left). But then we’re still left with wickets. Traditional cricket stats simply present runs and wickets side-by-side or in the form of an average. But that still leaves some questions unanswered-would you rather have a bowler averaging 20 at an economy of 6.00 or a bowler averaging 30 at an economy of 4.50? In the limited-overs game, the answer may not be immediately clear. Estimating the run value of a wicket can allow us reduce a bowler’s skill into one number.

This seems like a good time to note that nothing that follows is an innovative, new or unique exercise. These types of ideas have been previously put forward by smart people like this guy on YouTube, the fine folks over at CricViz, Jarrod Kimber at Cricinfo, and I’m sure many (many) others that I haven’t seen yet. Unfortunately, none of this data appears to be publicly available with an agreed-upon methodology. So to analyze the little corner of the cricket world I’m most interested in-Associate Cricket, and for this article, the T20 World Cup Qualifier-we have to do it ourselves.

Estimating the Run Value of a Wicket

To estimate the run value of a wicket, we take a simple empirical approach-no fancy math or model needed. Based on ball-by-ball data for all T20I matches in our database (first innings only), we can determine the average number of runs remaining in an innings at the beginning of each over, dependent on number of wickets lost.

For example, a team who has lost no wickets at the start of the 3rd over would expect to score another 128.2 runs on average. A team who has lost 1 wicket at the start of the 3rd over would expect to score another 121.0 runs on average. So if you lose 1 wicket in the 2nd over, your expected runs for the match have dropped by -7.2. The value of that wicket for the bowling team was a -7.2 run drop in the opponent’s expected score.

Obviously, wickets taken early or when you’ve already taken a few are more valuable than getting a third wicket in the last few overs. All in all, the average wicket is worth approximately -4 runs. This varies from some other estimates I’ve seen, but it doesn’t make a huge difference in our final analysis.

Adjusting for Match State of Bowler Appearances

Bowler usage strategy has a huge impact on a bowlers’ figures. In the 9th over with a couple wickets down, the probability of another wicket is something like 4%. But if you’re bowling at the death, wicket probability shoots up above 10%, along with dramatic increases to run rate. So it’s important to account for match state when analyzing a bowler’s figures.

The following two tables show the Average Run Rate and Wicket Probability by over and wickets lost for T20I matches. The data is empirical, but I did smooth it out-the outlined boxes did not see much real data, so I extrapolated these portions from existing data.

Determining Value of a Bowler

Now, we can throw all of this together to determine each bowler’s impact per over. Essentially, we start with the runs conceded by a bowler and subtract the number of wickets multiplied by the average run value of a wicket. This adjusted runs conceded can be used to calculate an adjusted economy rate, which we can then compare to their expected adjusted economy rate based on the match state of their overs bowled. This will finally give us a nice clean metric-runs allowed per over relative to the average bowler. Let’s get to the math, using Ahmed Raza as an example:

Ahmed Raza allowed 145 runs and took 6 wickets over 27 overs. The average bowler in this situation would allow 197.2 runs and take 6.5 wickets. Raza’s adjusted runs allowed are 146 – 46 = 122, making for an adjusted economy of 122/27 = 4.52. The average bowler in these situations would have an adjusted economy of 197.2 – 46.5 = 171.0/27 = 6.33. This means that relative to an average bowler, Ahmed Raza restricted his opponents’ total by an average of 4.52 – 6.33 = -1.81 runs per over.

This final number is called Bowler Impact. Now, we can take a look at the leaderboard for Bowler Impact over the course of the T20 World Cup Qualifier!

Top Bowlers at the 2019 T20 World Cup Qualifier

The following table shows the Top 10 bowlers at the 2019 T20 World Cup Qualifier. No surprise to see 3 bowlers from Papua New Guinea in the Top 5. The Papua New Guinea bowling attack restricted opponents to 116 runs or fewer in 4 of their 9 matches, in addition to totals of just 126 and 146 against the Netherlands and Scotland respectively in the group stage. (Full Table with more stats and all bowlers can be found here).

Let’s take a closer look at the Top 5 bowlers in this tournament.

Assad Vala, Damien Ravu, Norman Vanua

Assad Vala: Actual Figures: 95 Runs and 10 Wickets across 21 Overs; Expected Figures: 141.5 Runs and 5.5 Wickets

Damien Ravu: Actual Figures: 107 Runs and 12 Wickets across 21.3 Overs; Expected Figures: 133.0 Runs and 6.8 Wickets

Norman Vanua: Actual Figures: 132 Runs and 10 Wickets across 24.3 Overs; Expected Figures: 171.8 Runs and 8.3 Wickets

First, the three-headed monster from Papua New Guinea. Assad Vala was the match-winning standout of the group. He regularly helped PNG tear through opposing lineups in the middle overs and effectively restricted run totals, accounting for an astounding 3 fewer runs per over than the average bowler. Vala’s 3/7 figures in 4 overs against Kenya were massive in defending a low 118 total. Vala also single-handedly took Namibia from 80-5 to 86-8 in the group stage with 3 handy middle over wickets.

Damien Ravu took 5 wickets from just 10 Powerplay overs, including two in two against Singapore (overall figures of 4/18) to lead a successful defense of 180.

Finally, the all-around medium pace bowler Norman Vanua was vital in restricting runs in the Powerplay and at the death. Vanua allowed 23% fewer runs than the average bowler in his situations-his better work was at the opening of the innings, but he did have an outstanding 2-run, 1 wicket 18th over against Namibia in the semi-finals that helped propel Papua New Guinea to the final.

Collins Obuya

Actual Figures: 104 Runs, 11 Wickets over 17.5 Overs; Expected Figures: 123.4 Runs, 4.4 Wickets

The leg-spinning Obuya featured mostly in the mid-late overs, taking 11 wickets for just 63 runs between the 13th and 17th overs (9 overs bowled in this span). Unfortunately, much of this work was too little too late for Kenya. Obuya was a consistent performer during a relatively disappointing Qualifier for his team, taking 2 wickets each against Scotland, Papua New Guinea, and the Netherlands in losing efforts.

Mark Adair

Actual Figures: 150 Runs, 12 Wickets over 31.3 Overs; Expected Figures: 215.2 Runs, 8.8 Wickets

Adair often opened and closed the bowling for Ireland, with all but 2 of his 32 overs coming during the Powerplay or in the final four overs. He did a phenomenal job restricting runs in the Powerplay, with an economy of just 4.00 while taking 4 wickets. Most of his wickets came in the death, where he took 9 wickets for 92 runs across his 13 death overs. Perhaps his standout match was 2/9 from 3.2 overs in the 3rd place final against Namibia.

Conclusion

By using the average value of a typical wicket, we’re able to adjust a bowler’s runs to calculate an Adjusted Economy. Comparing this to the typical Adjusted Economy for the average bowler in the same situations, we can calculate how many runs a bowler subtracts (or adds) to the opponent’s final total relative to the average bowler. This methodology is not new or unique, but free publication of these figures is rare to non-existent. Consistent methodology and more freely available data across the cricket analytics world is necessary and would do a great deal of good towards progressing cricket analytics overall.

Design a site like this with WordPress.com
Get started