Introduction
As an American, I cut my sports analytics teeth in the world of baseball’s sabermetrics. A central tenet of baseball analytics is determining the average run value of each potential plate outcome. We can then determine the value added by a player in all their plate appearances and see how many runs above average they are worth over the course of a season. Baseball even goes a step further and accounts for fielding and base-running abilities to determine a player’s Wins Above Replacement.
In cricket, this type of exercise seems easier in theory-a run is a run, although we want to account for the match state (overs and wickets left). But then we’re still left with wickets. Traditional cricket stats simply present runs and wickets side-by-side or in the form of an average. But that still leaves some questions unanswered-would you rather have a bowler averaging 20 at an economy of 6.00 or a bowler averaging 30 at an economy of 4.50? In the limited-overs game, the answer may not be immediately clear. Estimating the run value of a wicket can allow us reduce a bowler’s skill into one number.
This seems like a good time to note that nothing that follows is an innovative, new or unique exercise. These types of ideas have been previously put forward by smart people like this guy on YouTube, the fine folks over at CricViz, Jarrod Kimber at Cricinfo, and I’m sure many (many) others that I haven’t seen yet. Unfortunately, none of this data appears to be publicly available with an agreed-upon methodology. So to analyze the little corner of the cricket world I’m most interested in-Associate Cricket, and for this article, the T20 World Cup Qualifier-we have to do it ourselves.
Estimating the Run Value of a Wicket
To estimate the run value of a wicket, we take a simple empirical approach-no fancy math or model needed. Based on ball-by-ball data for all T20I matches in our database (first innings only), we can determine the average number of runs remaining in an innings at the beginning of each over, dependent on number of wickets lost.
For example, a team who has lost no wickets at the start of the 3rd over would expect to score another 128.2 runs on average. A team who has lost 1 wicket at the start of the 3rd over would expect to score another 121.0 runs on average. So if you lose 1 wicket in the 2nd over, your expected runs for the match have dropped by -7.2. The value of that wicket for the bowling team was a -7.2 run drop in the opponent’s expected score.
Obviously, wickets taken early or when you’ve already taken a few are more valuable than getting a third wicket in the last few overs. All in all, the average wicket is worth approximately -4 runs. This varies from some other estimates I’ve seen, but it doesn’t make a huge difference in our final analysis.
Adjusting for Match State of Bowler Appearances
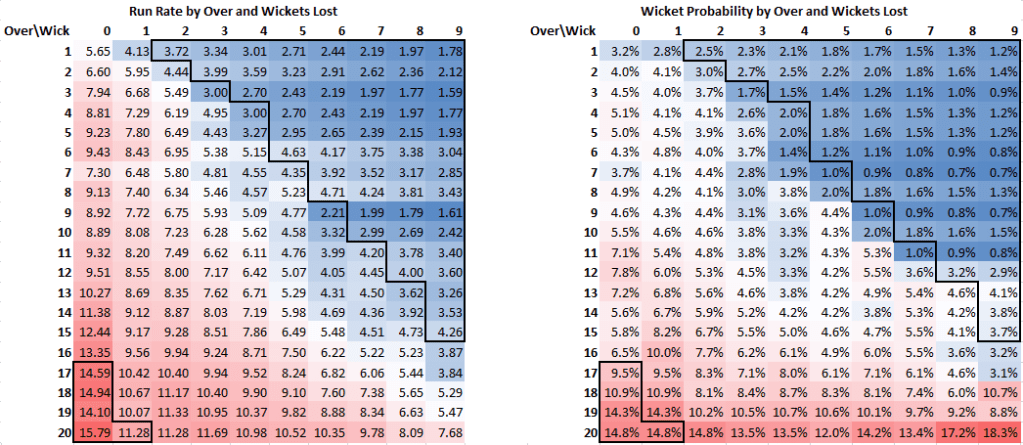
Bowler usage strategy has a huge impact on a bowlers’ figures. In the 9th over with a couple wickets down, the probability of another wicket is something like 4%. But if you’re bowling at the death, wicket probability shoots up above 10%, along with dramatic increases to run rate. So it’s important to account for match state when analyzing a bowler’s figures.
The following two tables show the Average Run Rate and Wicket Probability by over and wickets lost for T20I matches. The data is empirical, but I did smooth it out-the outlined boxes did not see much real data, so I extrapolated these portions from existing data.
Determining Value of a Bowler
Now, we can throw all of this together to determine each bowler’s impact per over. Essentially, we start with the runs conceded by a bowler and subtract the number of wickets multiplied by the average run value of a wicket. This adjusted runs conceded can be used to calculate an adjusted economy rate, which we can then compare to their expected adjusted economy rate based on the match state of their overs bowled. This will finally give us a nice clean metric-runs allowed per over relative to the average bowler. Let’s get to the math, using Ahmed Raza as an example:
Ahmed Raza allowed 145 runs and took 6 wickets over 27 overs. The average bowler in this situation would allow 197.2 runs and take 6.5 wickets. Raza’s adjusted runs allowed are 146 – 46 = 122, making for an adjusted economy of 122/27 = 4.52. The average bowler in these situations would have an adjusted economy of 197.2 – 46.5 = 171.0/27 = 6.33. This means that relative to an average bowler, Ahmed Raza restricted his opponents’ total by an average of 4.52 – 6.33 = -1.81 runs per over.
This final number is called Bowler Impact. Now, we can take a look at the leaderboard for Bowler Impact over the course of the T20 World Cup Qualifier!
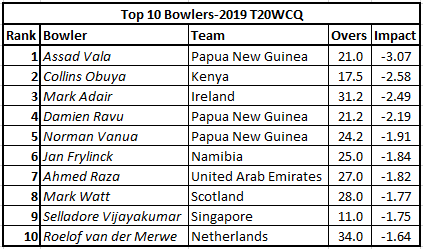
Top Bowlers at the 2019 T20 World Cup Qualifier
The following table shows the Top 10 bowlers at the 2019 T20 World Cup Qualifier. No surprise to see 3 bowlers from Papua New Guinea in the Top 5. The Papua New Guinea bowling attack restricted opponents to 116 runs or fewer in 4 of their 9 matches, in addition to totals of just 126 and 146 against the Netherlands and Scotland respectively in the group stage. (Full Table with more stats and all bowlers can be found here).
Let’s take a closer look at the Top 5 bowlers in this tournament.
Assad Vala, Damien Ravu, Norman Vanua
Assad Vala: Actual Figures: 95 Runs and 10 Wickets across 21 Overs; Expected Figures: 141.5 Runs and 5.5 Wickets
Damien Ravu: Actual Figures: 107 Runs and 12 Wickets across 21.3 Overs; Expected Figures: 133.0 Runs and 6.8 Wickets
Norman Vanua: Actual Figures: 132 Runs and 10 Wickets across 24.3 Overs; Expected Figures: 171.8 Runs and 8.3 Wickets
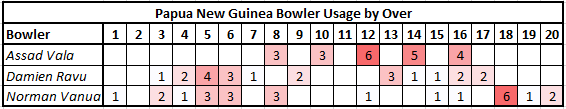
First, the three-headed monster from Papua New Guinea. Assad Vala was the match-winning standout of the group. He regularly helped PNG tear through opposing lineups in the middle overs and effectively restricted run totals, accounting for an astounding 3 fewer runs per over than the average bowler. Vala’s 3/7 figures in 4 overs against Kenya were massive in defending a low 118 total. Vala also single-handedly took Namibia from 80-5 to 86-8 in the group stage with 3 handy middle over wickets.
Damien Ravu took 5 wickets from just 10 Powerplay overs, including two in two against Singapore (overall figures of 4/18) to lead a successful defense of 180.
Finally, the all-around medium pace bowler Norman Vanua was vital in restricting runs in the Powerplay and at the death. Vanua allowed 23% fewer runs than the average bowler in his situations-his better work was at the opening of the innings, but he did have an outstanding 2-run, 1 wicket 18th over against Namibia in the semi-finals that helped propel Papua New Guinea to the final.
Collins Obuya
Actual Figures: 104 Runs, 11 Wickets over 17.5 Overs; Expected Figures: 123.4 Runs, 4.4 Wickets
The leg-spinning Obuya featured mostly in the mid-late overs, taking 11 wickets for just 63 runs between the 13th and 17th overs (9 overs bowled in this span). Unfortunately, much of this work was too little too late for Kenya. Obuya was a consistent performer during a relatively disappointing Qualifier for his team, taking 2 wickets each against Scotland, Papua New Guinea, and the Netherlands in losing efforts.
Mark Adair
Actual Figures: 150 Runs, 12 Wickets over 31.3 Overs; Expected Figures: 215.2 Runs, 8.8 Wickets
Adair often opened and closed the bowling for Ireland, with all but 2 of his 32 overs coming during the Powerplay or in the final four overs. He did a phenomenal job restricting runs in the Powerplay, with an economy of just 4.00 while taking 4 wickets. Most of his wickets came in the death, where he took 9 wickets for 92 runs across his 13 death overs. Perhaps his standout match was 2/9 from 3.2 overs in the 3rd place final against Namibia.
Conclusion
By using the average value of a typical wicket, we’re able to adjust a bowler’s runs to calculate an Adjusted Economy. Comparing this to the typical Adjusted Economy for the average bowler in the same situations, we can calculate how many runs a bowler subtracts (or adds) to the opponent’s final total relative to the average bowler. This methodology is not new or unique, but free publication of these figures is rare to non-existent. Consistent methodology and more freely available data across the cricket analytics world is necessary and would do a great deal of good towards progressing cricket analytics overall.

One thought on “Run Value of a Wicket, and Bowling Analysis of the T20 World Cup Qualifier”